Market Size and Forecast 2032
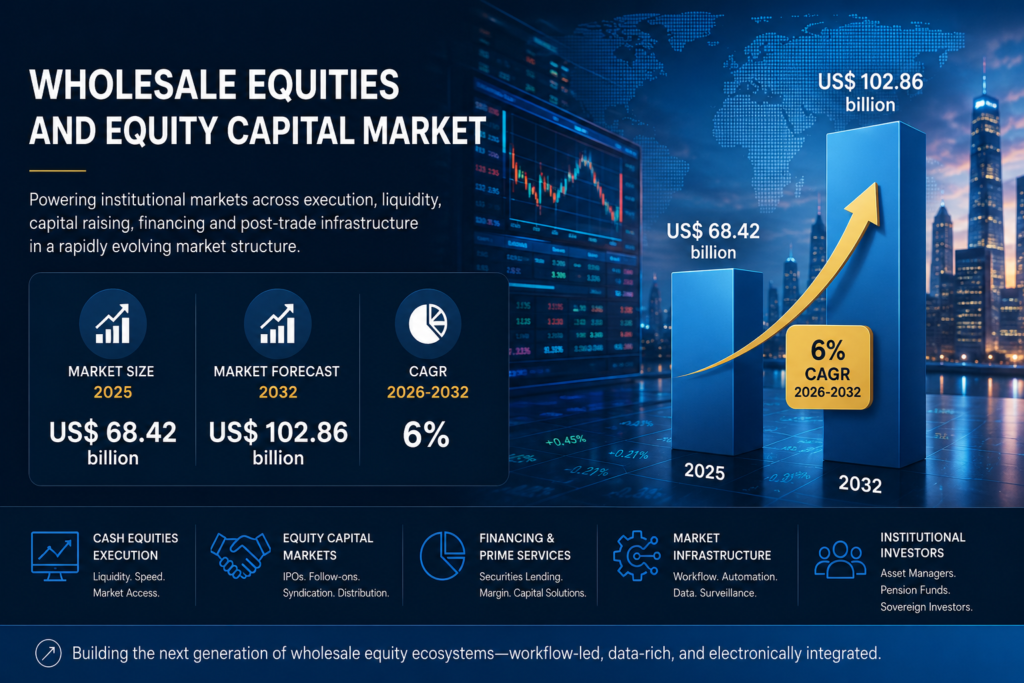
Wholesale equities and equity capital markets sit at the core of institutional market structure, spanning cash-equities execution, electronic trading, portfolio and block liquidity, securities financing, prime services, IPOs, follow-ons, convertibles, and the workflows that connect issuers, underwriters, investors, exchanges, and post-trade infrastructure.The global Wholesale Equities and Equity Capital Market size was US$ 68.42 billion in 2025 and forecasted to reach US$ 102.86 billion by 2032, with CAGR of 6% during 2026-2032.
The market remains commercially attractive because both sides of the franchise strengthened in 2025. The World Federation of Exchanges said the IPO market experienced a strong recovery in 2025 and that all regions reached record trading volumes and market capitalisation. Nasdaq likewise said the IPO market continued to rebound in 2025, with more IPOs and more capital raised. EY’s global IPO review went further, reporting 1,293 IPOs globally in 2025 that raised US$171.8 billion, up 39% by proceeds from 2024.
What is changing structurally is the basis of value creation. The market is no longer driven only by high-touch execution and episodic capital raising. It is increasingly shaped by electronic execution, smarter routing, workflow intelligence, faster settlement, consolidated data, and cross-platform control over syndication and distribution. LSEG describes itself as a provider of financial markets infrastructure spanning capital formation, trade execution, clearing, and risk management, while NYSE says its five equities markets operate on the NYSE Pillar platform to improve efficiency, consistency, performance, and resiliency.
A second structural shift is that infrastructure reform is increasingly becoming a commercial growth driver, not just a compliance exercise. In North America, DTCC continues to position accelerated settlement around lower settlement risk and stronger resilience. In Europe, the European Commission proposed 11 October 2027 for the move to T+1 settlement, and ESMA is building the consolidated tape regime for equities and ETFs. In the U.S., the SEC opened a comprehensive review of the Consolidated Audit Trail in April 2026. These changes matter because they push the industry toward automation, pre-settlement workflow discipline, and higher-value market data and surveillance infrastructure.
Executive Market Scope
| Metric | Value |
| Market Size in 2025 | US$ 68.42 Billion |
| Market Size in 2032 | US$ 102.86 Billion |
| CAGR 2026-2032 | 6% |
| Largest Function in 2025 | Cash Equities Execution and Sales Trading |
| Fastest-Growing Function | ECM Syndication, Bookbuilding and Distribution Intelligence |
| Largest Service Model in 2025 | High-Touch Sales Trading and Advisory |
| Largest End Use in 2025 | Asset Managers, Pension Funds and Sovereign Investors |
| Largest Region in 2025 | North America |
| Fastest Strategic Growth Region | Asia-Pacific |
| Largest Country Opportunity | USA |
| Highest Strategic Priority Market | USA |
| Key Strategic Trend | Shift from balance-sheet intermediation toward workflow-led, data-rich, and electronically integrated wholesale equity ecosystems |
A second structural change is the convergence of wholesale execution and capital formation technology. ECM activity is improving, but investor selectivity remains high, and workflow speed matters more than before. EY said 2025 IPO activity reflected renewed confidence but still a highly selective market, while CMG and other ECM workflow platforms are explicitly targeting real-time offering intelligence, firm-wide deal tracking, and faster bookbuilding coordination. That suggests future winners will be the firms that combine placement power and market judgment with strong systems of record and systems of execution.
Market Dynamics
Market Drivers
Global IPO and follow-on activity is recovering from the 2022 to 2023 slump
The clearest demand driver is the rebound in equity issuance. Nasdaq said 2025 marked the second consecutive year of improvement in IPO activity, and EY reported that 2025 global IPO proceeds rose 39% to US$171.8 billion. That directly supports underwriting, syndication, distribution, research, stabilization, and ECM workflow revenues.Record equity trading volumes are reinforcing wholesale execution demand
A second driver is the strength of secondary-market activity. WFE said all regions reached record trading volumes and market capitalisation in 2025. JPX separately reported that annual trading value for the Tokyo Stock Exchange Prime Market reached JPY 1,419.5587 trillion in 2025, an all-time high. Higher turnover supports cash execution, algorithmic trading, portfolio trading, research monetization, and prime-service usage.Market-structure modernization is pushing firms toward higher-value technology spending
A third driver is the continuing push into T+1, consolidated tapes, and more automated pre-settlement workflows. The European Commission’s proposal for an October 2027 move to T+1, ESMA’s consolidated tape process, and DTCC’s emphasis on faster matching and confirmation all point to heavier spending on automation and straight-through-processing tools. This is especially important in cross-border wholesale equities, where operational fragmentation still creates friction and cost.Market Restraints
ECM windows remain highly sensitive to volatility and issuer quality
The biggest restraint is that equity issuance has recovered, but it has not normalized into a smooth, always-open market. EY said issuance windows in 2025 still opened and closed abruptly and that investors favored scale, clarity, resilience, and stronger governance. That means ECM revenue remains vulnerable to volatility spikes and sudden risk-off conditions.Faster settlement and surveillance reforms raise operating complexity
A second restraint is that market-structure upgrades do not come free. DTCC notes that Europe’s path to T+1 will be more complex than North America’s because of fragmentation, while the SEC’s CAT review underscores the cost, governance, and data-burden debates still surrounding surveillance infrastructure. These reforms improve resilience, but they also force banks, brokers, and asset managers to invest heavily in post-trade controls and data architecture.Technology differentiation is becoming expensive
The final restraint is that wholesale-equities clients increasingly expect low latency, higher customization, better execution analytics, and integrated liquidity tools. Goldman’s Atlas rebuild and NYSE’s Pillar platform both illustrate how much ongoing investment is now required just to remain competitive in execution. This favors scaled incumbents and makes it harder for smaller players to compete on infrastructure quality alone.Market Segmentation
By Function
Cash Equities Execution and Sales Trading generated US$ 16.88 billion in 2025, representing 24.7% of total market revenue, and is projected to reach US$ 24.22 billion by 2032. This segment leads because core institutional cash execution remains the anchor of the franchise across agency flow, principal risk transfer, research monetization, and client coverage. Record equity turnover in 2025 and the depth of U.S. and Japanese markets support this segment’s leadership.Electronic and Algorithmic Trading generated US$ 12.42 billion in 2025 and is projected to reach US$ 19.08 billion by 2032. This segment remains strategically important because low-touch execution and algorithmic routing are now essential for institutional flow. Goldman says Atlas is designed for lower latency, increased capacity, and new workflows, which captures the underlying direction of the segment very well.
Portfolio Trading and Block Liquidity Solutions generated US$ 8.74 billion in 2025 and is projected to reach US$ 13.02 billion by 2032. This segment benefits from institutional demand for efficient basket execution, ETF hedging, and portfolio transition tools, especially in higher-volume markets where liquidity access and market impact control matter more.
Prime Brokerage and Securities Financing generated US$ 10.26 billion in 2025 and is projected to reach US$ 14.86 billion by 2032. This remains a major revenue pool because hedge funds, multi-strategy firms, and active institutional investors rely on financing, custody, synthetic exposure, and execution services in one integrated relationship. The Bank of England’s January 2025 speech on prime brokerage reinforces the importance of liquidity, resilience, and counterparty management in this segment.
Equity Capital Markets Origination and Underwriting generated US$ 11.04 billion in 2025 and is projected to reach US$ 16.62 billion by 2032. This category is supported by the 2025 rebound in IPO and follow-on activity and remains central to capital formation, especially in the U.S., Asia, and technology-heavy issuance markets.
ECM Syndication, Bookbuilding and Distribution Intelligence generated US$ 9.08 billion in 2025 and is projected to reach US$ 15.06 billion by 2032, making it the fastest-growing function segment. Growth is being driven by the digitization of deal communication, compliance tracking, investor targeting, and live distribution management. CMG explicitly positions itself as a workflow and data intelligence platform for ECM participants, and TD Securities’ decision to join as investor and client reflects the importance of this direction.
By Service Model
High-Touch Sales Trading and Advisory generated US$ 18.22 billion in 2025, representing 26.6% of total market revenue, and is projected to reach US$ 26.42 billion by 2032. This segment remains the largest because complex block execution, issuer dialogue, investor feedback, and syndication still depend on human judgment, especially during volatile markets and sensitive issuance windows.Multi-Dealer and Agency Electronic Execution Platforms generated US$ 13.46 billion in 2025 and is projected to reach US$ 20.46 billion by 2032. This segment is expanding as clients seek lower latency, more customizable execution, and broader venue access. Goldman’s Atlas and NYSE Pillar both support the ongoing modernization of this model.
Integrated Prime, Financing and Post-Trade Services generated US$ 12.06 billion in 2025 and is projected to reach US$ 17.42 billion by 2032. This remains a structurally important service layer because financing, margining, post-trade operations, and risk management continue to sit at the center of institutional client relationships.
ECM Advisory, Underwriting and Syndication Services generated US$ 14.08 billion in 2025 and is projected to reach US$ 21.24 billion by 2032. The segment benefits directly from stronger IPO and follow-on conditions in 2025 and from the continued importance of issuer preparation, timing, valuation judgment, and investor education.
Cloud and SaaS ECM Workflow, Data and Compliance Platforms generated US$ 10.60 billion in 2025 and is projected to reach US$ 17.32 billion by 2032. This is the fastest-growing service-model segment because ECM processes are becoming more data-intensive, more regulated, and more collaborative across the sell side and buy side. CMG’s workflow and data-intelligence model fits this trend directly.
By End Use
Asset Managers, Pension Funds and Sovereign Investors generated US$ 19.86 billion in 2025, representing 29.0% of total market revenue, and are projected to reach US$ 29.82 billion by 2032. This segment leads because long-only institutions remain the largest users of execution, block liquidity, research, and ECM allocations across global equity markets.Hedge Funds, Quant Firms and Proprietary Trading Firms generated US$ 15.24 billion in 2025 and is projected to reach US$ 22.76 billion by 2032. These clients remain critical because they are heavy users of electronic execution, portfolio trading, securities financing, and prime services. Goldman’s prime-services and electronic-trading positioning is especially relevant here.
Corporates, Financial Sponsors and PE-Backed Issuers generated US$ 13.28 billion in 2025 and is projected to reach US$ 19.92 billion by 2032. This segment benefits directly from ECM recovery, especially large IPOs, sponsor-backed deals, and follow-on capital raising. EY and Nasdaq both show that 2025 issuance favored larger, better-prepared issuers.
Wealth Platforms, Broker-Dealers and Private Banks generated US$ 9.62 billion in 2025 and is projected to reach US$ 14.48 billion by 2032. This segment remains commercially relevant because wholesale equities infrastructure increasingly influences how brokerage and private-bank platforms source liquidity and distribute capital-markets product.
Exchanges, Clearing Houses and Other Market Infrastructure Participants generated US$ 10.42 billion in 2025 and is projected to reach US$ 15.88 billion by 2032. This group is gaining importance because infrastructure operators are increasingly central to data, trading, surveillance, settlement, and tokenization-led modernization. LSEG, NYSE, ESMA, and DTCC all reinforce this direction.
Regional Analysis
North America Wholesale Equities and Equity Capital Market
North America generated US$ 24.86 billion in 2025 and is projected to reach US$ 36.82 billion by 2032. The region leads because the U.S. remains the deepest equity market in the world. Nasdaq said the U.S. equity market represents approximately 50% of global equity market capitalization, and North America also benefits from the completed move to T+1, advanced surveillance infrastructure, and the strongest concentration of large global investment banks and exchanges.USA Wholesale Equities and Equity Capital Market
The United States generated US$ 21.42 billion in 2025 and is projected to reach US$ 31.98 billion by 2032. It is the largest country opportunity because it combines the deepest secondary liquidity, the most powerful ECM engine by proceeds, the most advanced market-structure stack, and the broadest concentration of wholesale-equities technology investment. EY said the U.S. led the world by IPO proceeds in 2025, while Nasdaq highlighted the scale and liquidity depth of U.S. capital markets.Europe Wholesale Equities and Equity Capital Market
Europe generated US$ 19.44 billion in 2025 and is projected to reach US$ 29.14 billion by 2032. The region remains strategically important because it is simultaneously modernizing its post-trade cycle and building a new market-data architecture. The European Commission’s T+1 proposal and ESMA’s consolidated tape regime are both structural changes that should strengthen cross-border efficiency and data usability over time.Germany Wholesale Equities and Equity Capital Market
Germany generated US$ 4.88 billion in 2025 and is projected to reach US$ 7.36 billion by 2032. Germany remains one of Europe’s most important wholesale-equities and ECM markets because it combines exchange infrastructure, institutional investor depth, and a central role in Europe’s consolidated-tape and settlement modernization agenda. It is also the launch location for the first AWS European Sovereign Cloud region, which indirectly reinforces Germany’s broader position as a financial and infrastructure hub for regulated digital markets.United Kingdom Wholesale Equities and Equity Capital Market
The United Kingdom generated US$ 5.12 billion in 2025 and is projected to reach US$ 7.44 billion by 2032. The UK remains highly relevant because London still anchors a major share of Europe’s global-bank equities franchises, electronic execution, and ECM syndication capabilities, even though domestic IPO conditions have been comparatively weak.Asia-Pacific Wholesale Equities and Equity Capital Market
Asia-Pacific generated US$ 16.88 billion in 2025 and is projected to reach US$ 29.62 billion by 2032, making it the fastest strategic growth region. EY said Asia-Pacific captured 43% of global IPO proceeds in 2025, driven largely by Hong Kong and mainland China-linked activity, and JPX reported record Prime Market trading value in 2025. HKEX’s 2025 annual-report data also showed 119 new listings raising HK$286.9 billion, up 226% from 2024.Japan Wholesale Equities and Equity Capital Market
Japan generated US$ 4.02 billion in 2025 and is projected to reach US$ 6.86 billion by 2032. Japan remains a high-quality market because JPX reported all-time-high annual trading value for the Prime Market in 2025 and because the Tokyo market continues to benefit from corporate-governance reform, underwriting reform discussion, and growing institutional engagement.Hong Kong Wholesale Equities and Equity Capital Market
Hong Kong generated US$ 3.46 billion in 2025 and is projected to reach US$ 6.48 billion by 2032. Hong Kong is one of the region’s most important ECM growth centers because HKEX said it was the world’s leading IPO market in 2025 by fundraising, with 119 new listings and HK$286.9 billion raised. That makes Hong Kong especially important for global and regional underwriting franchises.India Wholesale Equities and Equity Capital Market
India generated US$ 2.84 billion in 2025 and is projected to reach US$ 5.62 billion by 2032. India remains strategically important because EY identified it as the leading market globally by IPO deal count in 2025, reinforcing its growing role in ECM origination and domestic capital formation.Competitive Landscape
The Wholesale Equities and Equity Capital Market is highly competitive but increasingly concentrated around scaled global banks, exchange groups, and platform providers that can combine liquidity access, capital formation, data, and workflow control. Competition is no longer defined only by balance sheet, brand, or exchange membership. It is increasingly defined by whether a firm can combine execution quality, electronic routing, financing depth, issuance access, and workflow intelligence in one client proposition.Competition is increasingly shaped by three factors. The first is infrastructure depth, because clients expect lower-latency, more resilient execution and more automated post-trade outcomes. The second is ECM workflow control, because issuers and underwriters increasingly need real-time distribution intelligence and compliance-grade deal tracking. The third is regulatory adaptability, since T+1, CAT, consolidated tapes, and tokenized-securities initiatives are all redefining how market participants build systems for the next cycle of wholesale-equities growth.
Key Company Profiles
Intercontinental Exchange and NYSE
Intercontinental Exchange remains one of the most strategically important players because NYSE combines listing power, secondary-market liquidity, and market-structure technology. NYSE says its five equities markets operate on NYSE Pillar, and in January 2026 it announced development of a tokenized-securities platform intended to support 24x7 trading, fractional share trading, and immediate settlement through tokenized capital, subject to regulatory approvals. That combination of current scale and forward-looking infrastructure makes ICE central to this market.LSEG
LSEG remains highly relevant because it explicitly spans capital formation, trade execution, clearing, risk management, and workflow-enabling data products. Its annual report positions the group across the trade lifecycle and data value chain, which is precisely the direction wholesale equities and ECM are moving toward.Goldman Sachs
Goldman Sachs remains strategically important because it continues to invest in both prime and execution infrastructure. Goldman says Atlas is part of a multi-year rebuild of its global trading infrastructure and is designed for lower latency, increased capacity, and new workflows and client customizations. It also positions Prime Services around cash equities, futures, options, direct market access, smart order routing, and integrated risk and liquidity tools.J.P. Morgan
J.P. Morgan remains a major force because it explicitly positions itself as a global leader in equity capital markets across IPOs, common stock offerings, convertibles, and private placements. That breadth, combined with its global institutional franchise, keeps it central to ECM origination, syndication, and underwriting competition.Capital Markets Gateway
Capital Markets Gateway is increasingly important because it represents the workflow-digitization side of ECM modernization. CMG says it offers workflow management and data intelligence for all ECM participants, while its broader positioning centers on real-time offering information, historical data, compliance visibility, and a single system of record. TD Securities joining as both investor and client reinforces the commercial relevance of that model.Recent Developments
- In April 2026, the SEC opened a comprehensive review of the Consolidated Audit Trail and related data sources used in U.S. securities-market regulation. This matters because surveillance, data cost, and reporting architecture are now part of the commercial and operational future of wholesale equities.
- In April 2026, ESMA published Q&As on the onboarding of data contributors and operational rules for the EU’s consolidated tapes. This is commercially meaningful because the equities and ETF consolidated tape is a major step in Europe’s market-data modernization and should improve transparency and cross-venue usability over time.
- In February 2026, Nasdaq said the IPO market gained strength in 2025, with more IPOs, more SPACs, and more capital raised for the second consecutive year of recovery. This is important because it reinforces that ECM conditions are improving after the 2022 to 2023 downturn.
- In January 2026, the New York Stock Exchange announced development of a platform for tokenized securities that would support 24x7 trading, fractional share trading, and on-chain settlement if approved. This matters because it shows leading exchange operators preparing for a future where equity-market infrastructure becomes more continuous, programmable, and settlement-efficient.
- In February 2025, the European Commission proposed 11 October 2027 as the date for the shift to T+1 settlement in EU capital markets. This remains strategically important because the move should raise the value of automation, matching, confirmation, and post-trade control across wholesale-equities workflows.
North America should remain the largest monetization base because the U.S. still represents roughly half of global equity market capitalization and remains the most important global venue for liquidity and proceeds. Europe should remain a structurally important modernization market because consolidated tapes and T+1 are changing the economics of data and operations. Asia-Pacific should be the fastest strategic growth region because IPO proceeds and trading activity are rebounding strongly, especially across Hong Kong, Japan, and India. By 2032, the firms best positioned to lead this market will be those that combine liquidity, client reach, workflow intelligence, and regulatory-ready infrastructure rather than relying on distribution or balance sheet alone.